PORTFOLIO
December 19, 2025

August 19, 2025

June 26, 2025
April 23, 2025

March 26, 2025

June 11, 2024

September 6, 2023

July 18, 2023

May 3, 2023
July 13, 2022
March 7, 2022
September 21, 2021
August 26, 2021
May 13, 2021

December 16, 2020
July 16, 2020

June 8, 2020
May 7, 2020
March 16, 2020
March 11, 2020
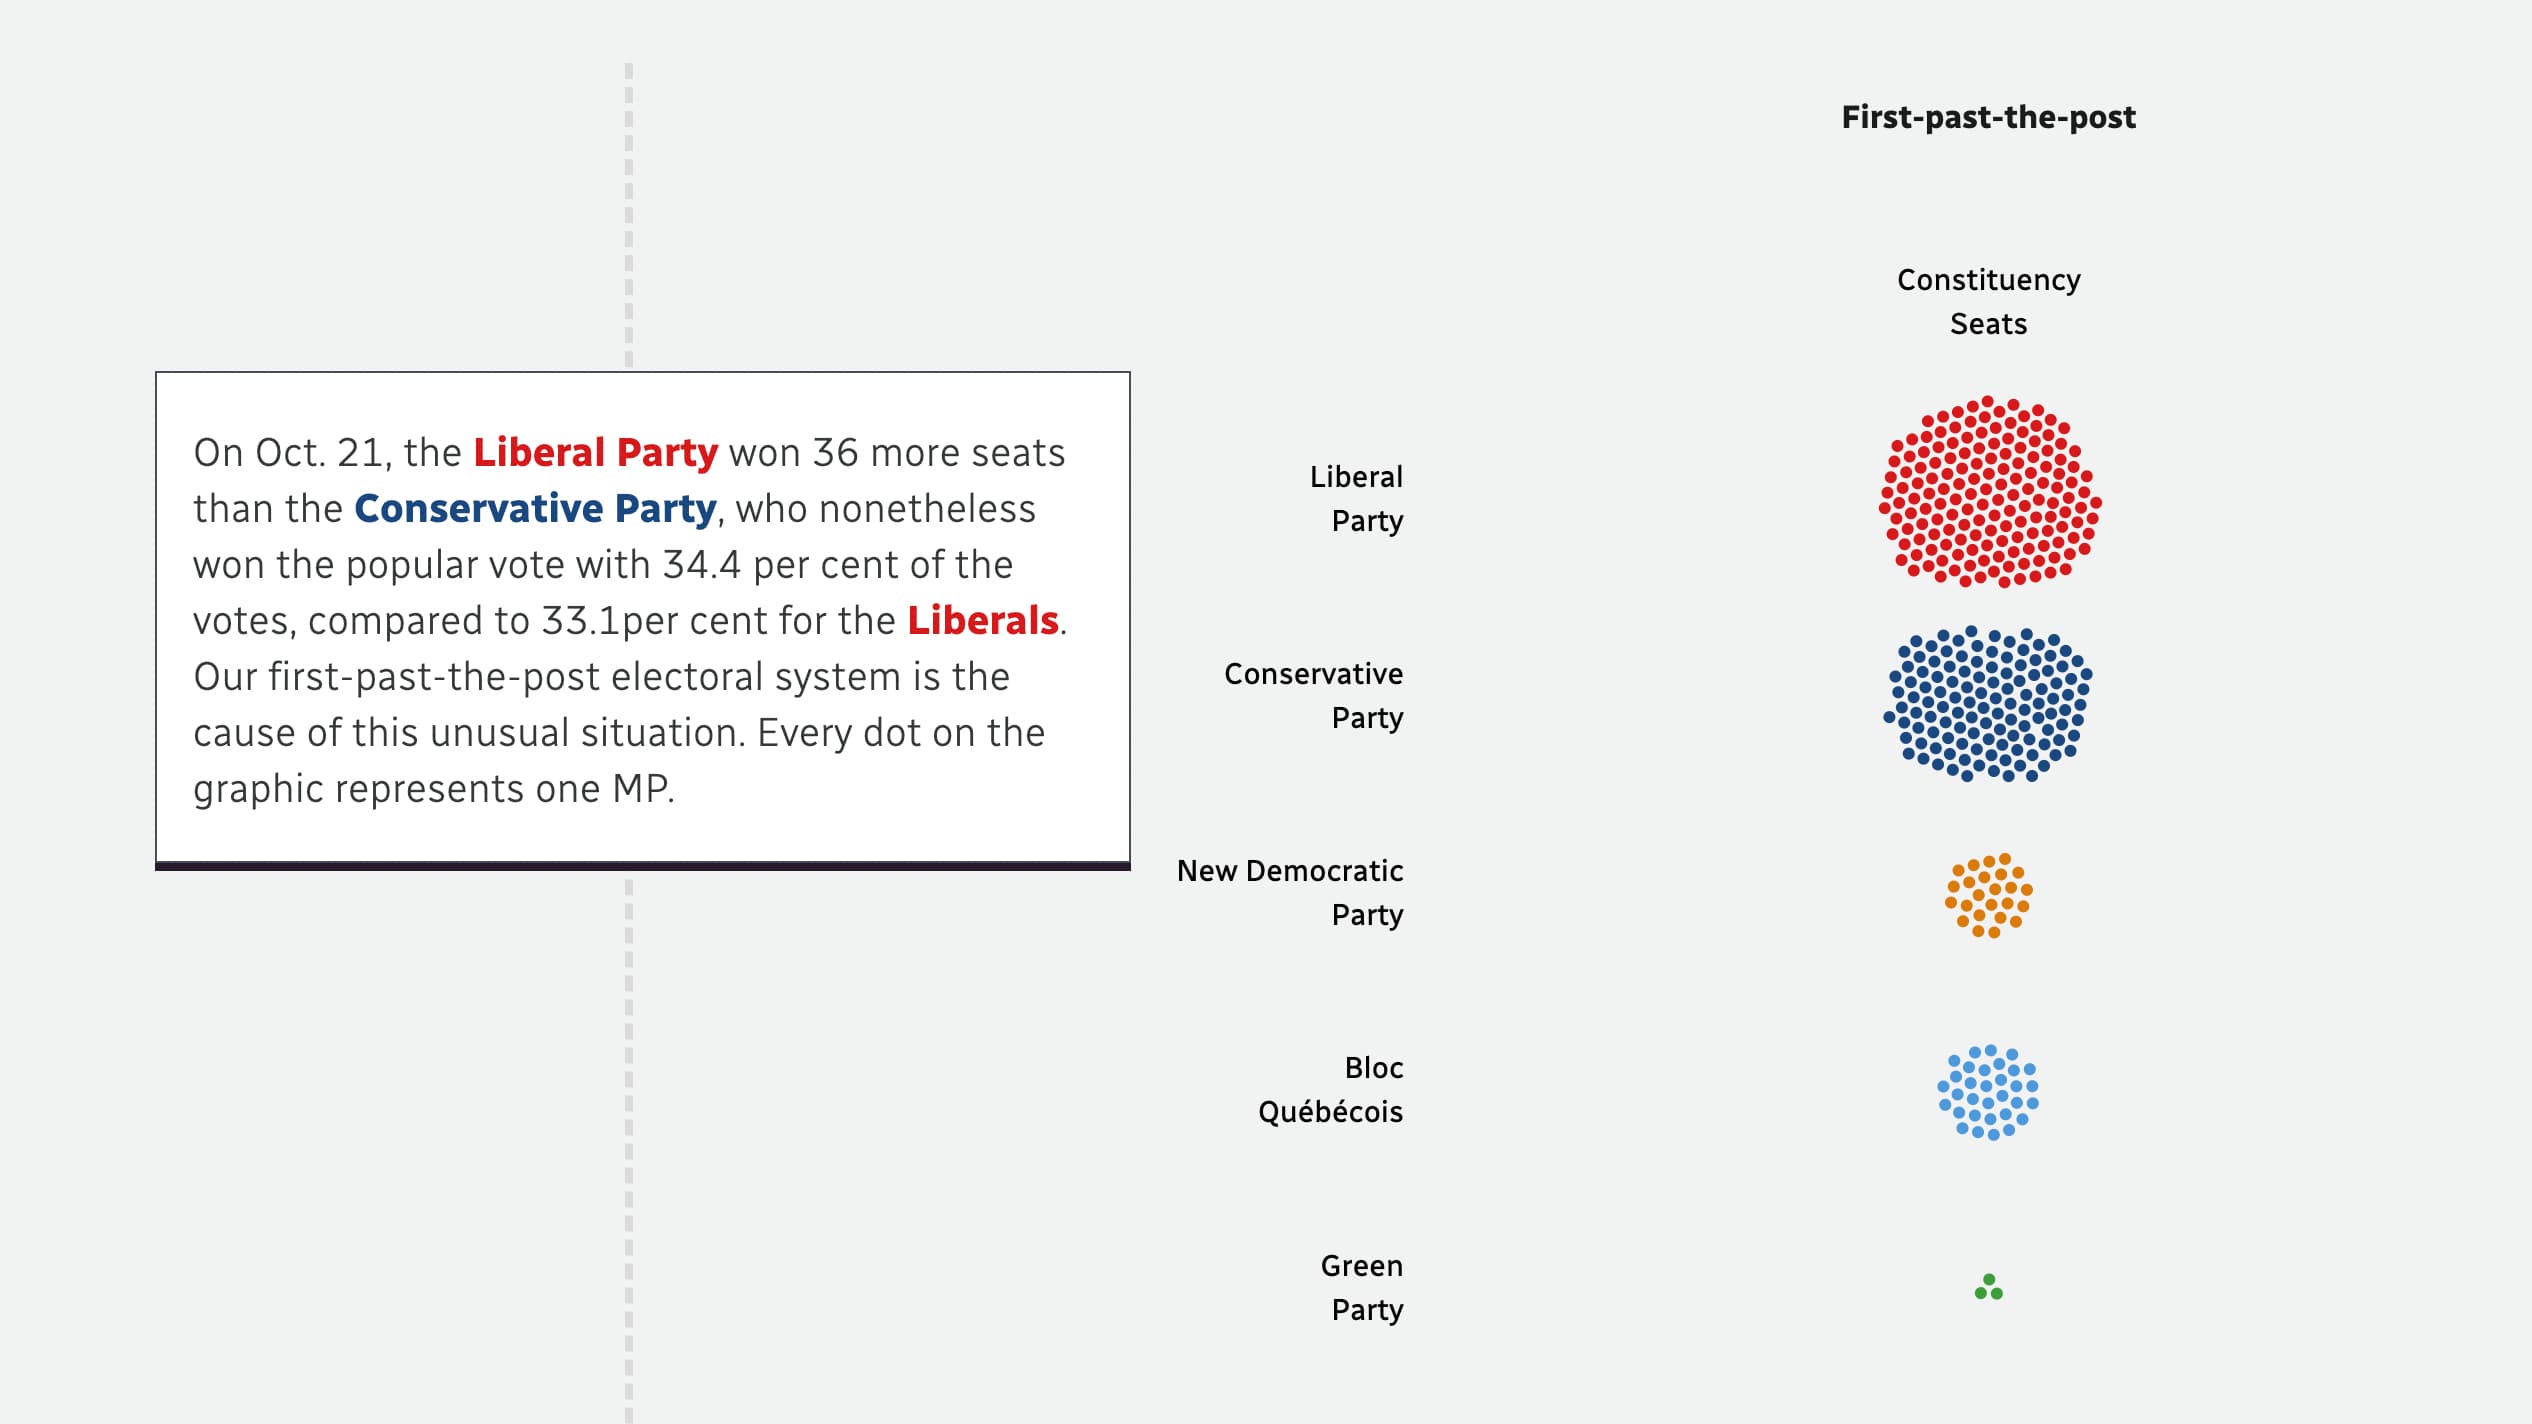
October 23, 2019
September 4, 2019
April 30, 2019
March 5, 2019